Comprehension:
In the following, a year corresponds to $1^{\text {st }}$ of January of that year.
A study to determine the mortality rate for a disease began in $1980$. The study chose $1000$ males and $1000$ females and followed them for forty years or until they died, whichever came first. The $1000$ males chosen in $1980$ consisted of $250$ each of ages $10$ to less than $20,20$ to less than $30,30$ to less than $40$ , and $40$ to less than $50$. The $1000$ females chosen in $1980$ also consisted of $250$ each of ages $10$ to less than $20,20$ to less than $30,30$ to less than $40$, and $40$ to less than $50$.
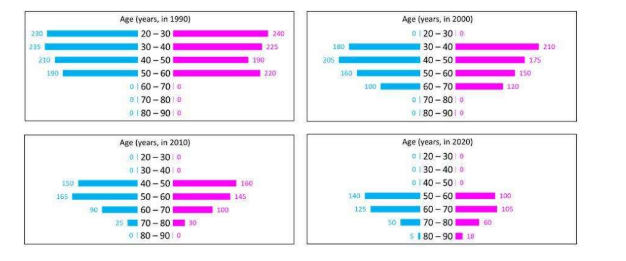
The four figures below depict the age profile of those among the $2000$ individuals who were still alive in $1990,2000$, $2010$, and $2020$. The blue bars in each figure represent the number of males in each age group at that point in time, while the pink bars represent the number of females in each age group at that point in time. The numbers next to the bars give the exact numbers being represented by the bars. For example, we know that $230$ males among those tracked and who were alive in $1990$ were aged between $20$ and $30$.
How many individuals who were being tracked and who were less than $30$ years of age in $1980$ survived until $2020$?
- $580$
- $470$
- $240$
- $230$