• edited by
1,512 views
0 0 votes

The multi-layered pie-chart below shows the sales of LED television sets for a big retail electronics outlet during $2016$ and $2017$. The outer layer shows the monthly sales during this period, with each label showing the month followed by sales figure of that month. For some months, the sales figures are not given in the chart. The middle-layer shows quarter-wise aggregate sales figures (in some cases, aggregate quarter-wise sales numbers are not given next to the quarter). The innermost layer shows annual sales. It is known that the sales figures during the three months of the second quarter (April, May, June) of $2016$ form an arithmetic progression, as do the three monthly sales figures in the fourth quarter (October, November, December) of that year.
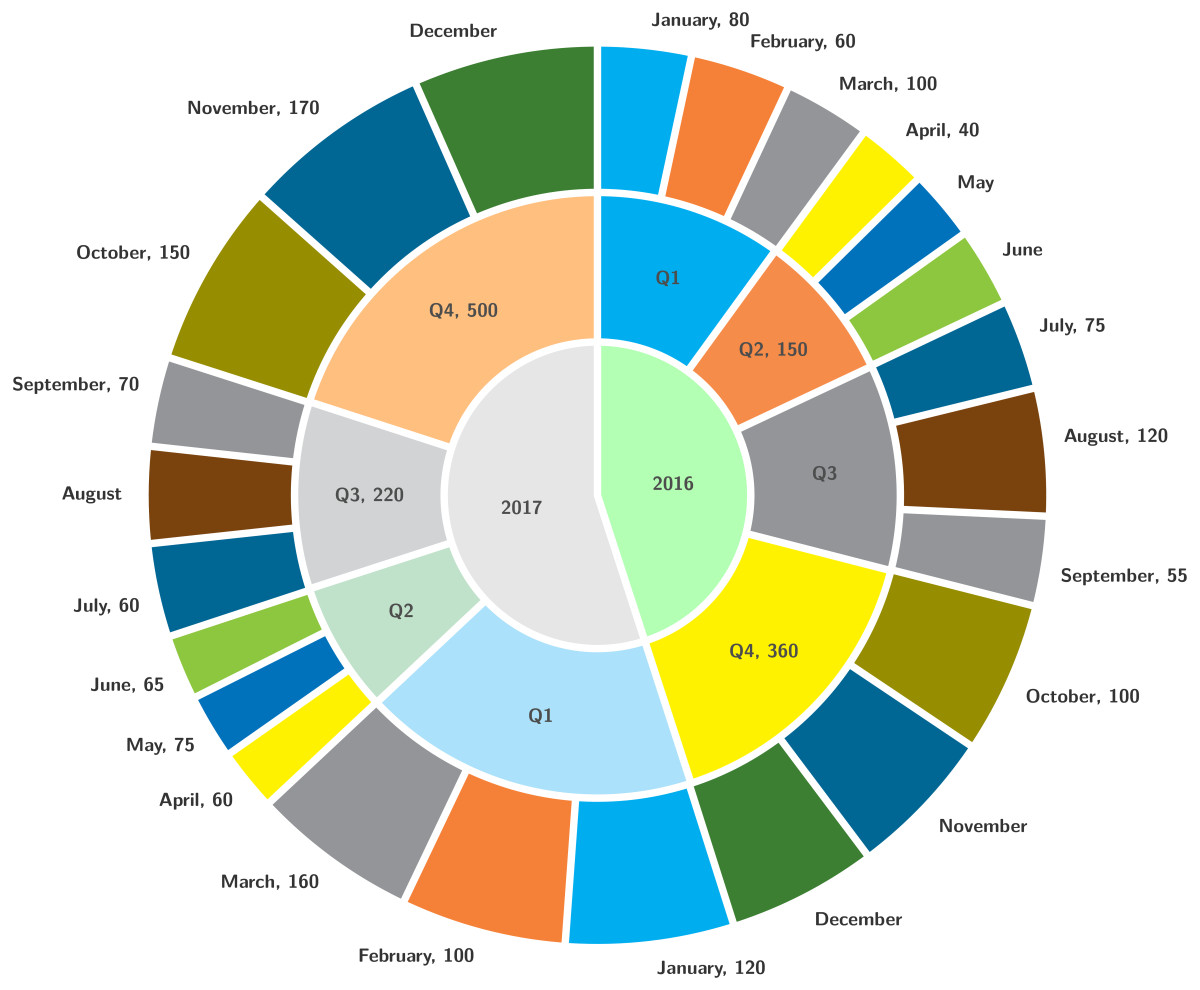
Nested pie chart

What is the percentage increase in sales in December $2017$ as compared to the sales in December $2016$?

  1. $28.57$
  2. $22.22$
  3. $50.00$
  4. $38.46$

Please log in or register to answer this question.

Position:
Show:

Related questions

0 0 votes
0 0 answers
1.2k
1.2k views
go_editor asked Mar 19, 2020
1,235 views
The multi-layered pie-chart below shows the sales of LED television sets for a big retail electronics outlet during $2016$ and $2017$. The outer layer shows the monthly s...
0 0 votes
0 0 answers
1.1k
1.1k views
go_editor asked Mar 19, 2020
1,141 views
The multi-layered pie-chart below shows the sales of LED television sets for a big retail electronics outlet during $2016$ and $2017$. The outer layer shows the monthly s...
0 0 votes
0 0 answers
1.6k
1.6k views
go_editor asked Mar 19, 2020
1,591 views
The multi-layered pie-chart below shows the sales of LED television sets for a big retail electronics outlet during $2016$ and $2017$. The outer layer shows the monthly s...
0 0 votes
1 1 answer
3.0k
3.0k views
Krithiga2101 asked Mar 7, 2020
2,991 views
Each of the following pie charts gives the percentage split up of the total time spent by a certain student towards preparation of CAT $2005$If atleast $5\%$ of the time ...
3 3 votes
1 answers 1 answer
2.8k
2.8k views
Misbah Ghaya asked Oct 3, 2017
2,773 views
Refer to the following pie-chartThe equity base of these companies remained unchanged. Then the total dividend earning (in lakh rupees) by the share holders in 1991-92 is...