A company produces five types of shirts - A, B, C, D, E - using cloth of three qualities - High, Medium and Low - using dyes of three qualities - High, Medium, and Low. The following tables give, respectively: 1. The number of shirts (of each category) produced, in thousands. 2. The percentage distribution of cloth quality in each type of shirt, and 3. The percentage distribution of dye quality in each type of shirt.
Note: Each shirt requires 1.5 metres of cloth
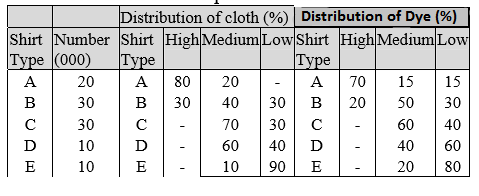
What is the ratio of low-quality dye used for C-shirts to that used for D-shirts?
- 3:2
- 2:1
- 1:2
- 2:3