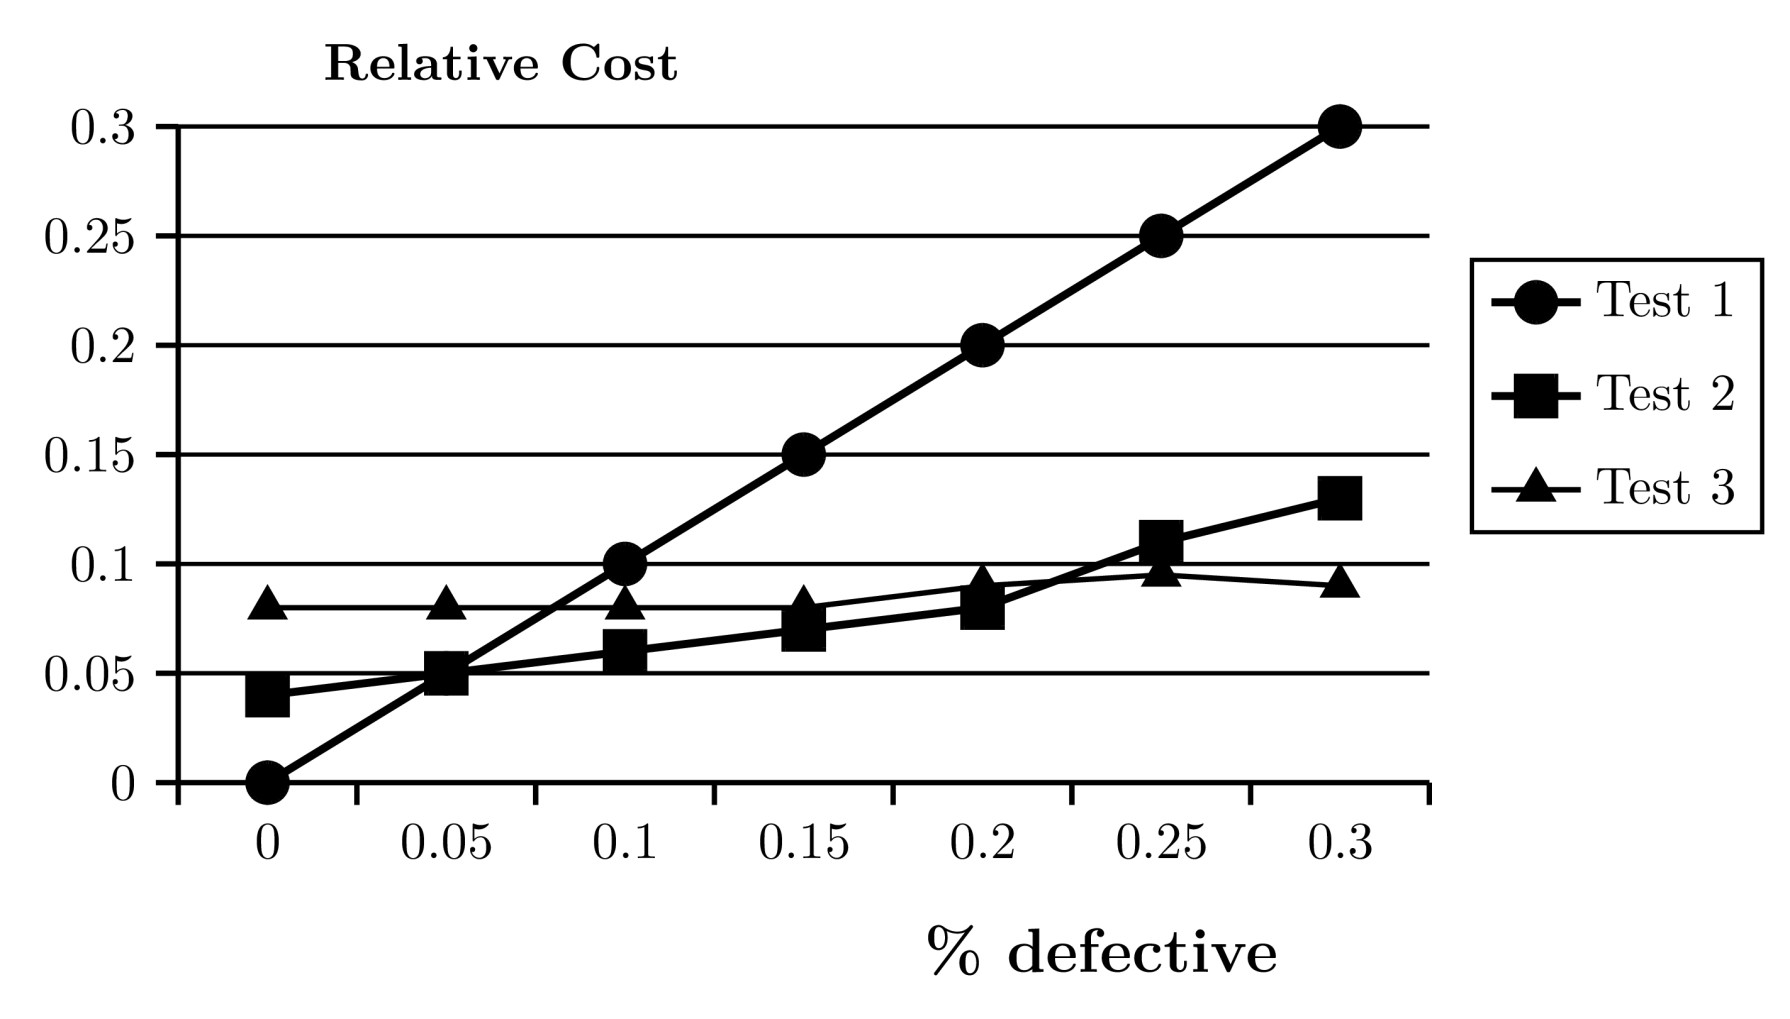
0 votes 0 votes use the following data: A manufacturer can choose from any of the three types of tests available for checking the quality of his product. The graph gives the relative costs for each of these tests for a given percentage of defective pieces. Quantitative Aptitude cat1996 quantitative-aptitude data-interpretation graphs + – makhdoom ghaya asked Jul 16, 2017 • edited Apr 23 by Counsellor makhdoom ghaya 8.1k points 2.3k views answer comment Share See all 0 reply Please log in or register to add a comment.
1 votes 1 votes 1 2 3 4 heyya answered Mar 16, 2022 heyya 40 points comment Share See all 0 reply Please log in or register to add a comment.