edited by
1,665 views
0 0 votes

Answer the following question based on the information given below.

The bar chart shows the revenue received, in million US Dollars (USD), from subscribers to a particular Internet service. The data covers the period $2003-2007$ for the Unites States (US) and Europe. The bar chart also shows the estimated revenues from subscription to this service for the period $2008 – 2010.$

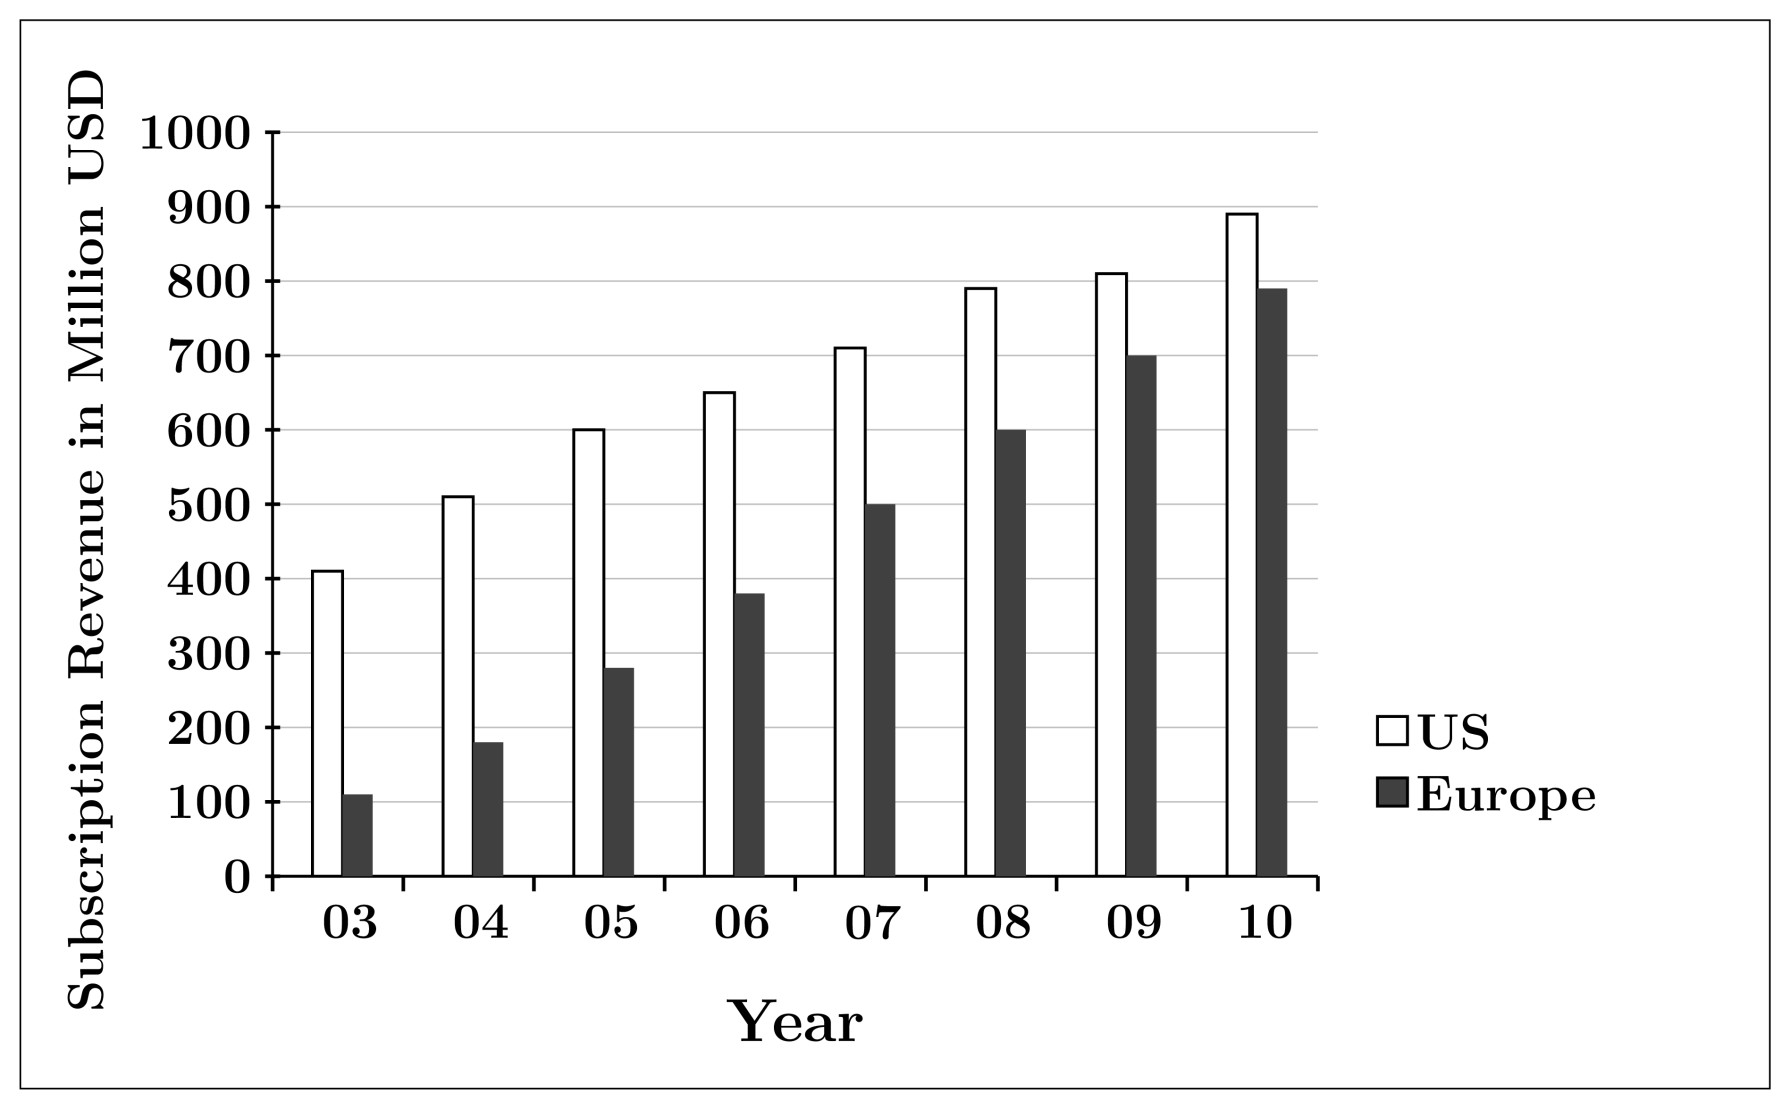
Consider the annual percent change in the gap between subscription revenues in the US and Europe. What is the year in which the absolute value of this change is the highest?

  1. $03-04$
  2. $05-06$
  3. $06-07$
  4. $08-09$
  5. $09-10$

Please log in or register to answer this question.

Related questions

0 0 votes
0 0 answers
1.5k
1.5k views
go_editor asked Apr 30, 2016
1,532 views
Answer the following question based on the information given below.The bar chart shows the revenue received, in million US Dollars (USD), from subscribers to a particular...
0 0 votes
0 0 answers
1.7k
1.7k views
go_editor asked Nov 30, 2015
1,661 views
Answer the following question based on the information given below.The bar chart shows the revenue received, in million US Dollars (USD), from subscribers to a particular...
1 1 vote
0 0 answers
1.3k
1.3k views
Lakshman Bhaiya asked Mar 28, 2022
1,347 views
Answer the following questions based on the information given below.The telecom operators get revenue from transfer of data and voice. Average revenue received from trans...
0 0 votes
0 0 answers
1.1k
1.1k views
Lakshman Bhaiya asked Mar 28, 2022
1,139 views
Answer the following questions based on the information given below.The telecom operators get revenue from transfer of data and voice. Average revenue received from trans...
0 0 votes
0 0 answers
1.4k
1.4k views
go_editor asked Apr 28, 2016
1,362 views
Answer the following question based on the information given below.There are $100$ employees in an organization across five departments. The following table gives the dep...