$\textbf{Directions (68 - 72) : }$ Study the following pie-chart and table carefully to answer the questions given below :
The following pie-chart shows the distribution of monthly budget of a person.
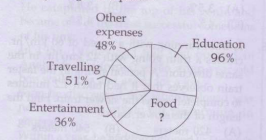
The following table shows the further distribution (in percent) of the above-mentioned items among the five family members i.e. P (the person himself), W (his wife), Rahul (son), Rohit (son), and Preeti (his daughter). His monthly family budget is $\text{Rs. 1,20,000}$.
$\begin{array}{|c|c|c|c|c|c|} \hline \text{Family member} & \text{Education} & \text{Food} & \text{Entertainment} & \text{Travelling} &\text{Other Expenses} \\\hline \text{P} & 10 & 30 & 10 & 40 & 20 \\\hline \text{W} & 15 & 25 & 30 & 10 & 25 \\\hline \text{Rahul} & 40 & 20 & 20 & 25 & 20 \\\hline \text{Rohit} & 25 & 15 & 25 & 10 & 10 \\\hline \text{Preeti} & 10 & 10 & 15 & 15 & 25 \\\hline \end{array}$
Find the difference (in percentage of the budget) between the average expenses of Education and the average expenses on Entertainment of the couple.
- $1.3 \%$
- $1.9 \%$
- $2.2 \%$
- $2.5 \%$