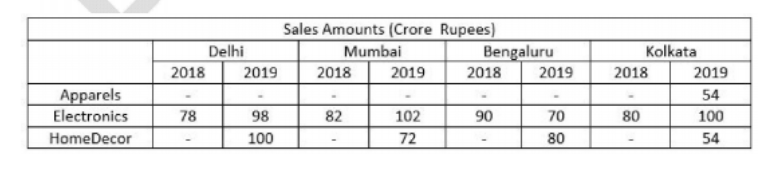
A chain of departmental stores has outlets in Delhi, Mumbai, Bengaluru and Kolkata. The sales are categorized by its three departments – ‘Apparel’, ‘Electronics’, and ‘HomeDecor’. An Accountant has been asked to prepare a summary of the $2018$ and $2019$ sales amounts for an internal report. He has collated partial information and prepared the following table.
The following additional information is known.
- The sales amounts in the Apparel departments were the same for Delhi and Kolkata in $2018.$
- The sales amounts in the Apparel departments were the same for Mumbai and Bengaluru in $2018.$ This sales amount matched the sales amount in the Apparel departments for Delhi in $2019.$
- The sales amounts in the HomeDecor departments were the same for Mumbai and Kolkata in $2018.$
- The sum of the sales amounts for four Electronics departments increased by the same amount as the sum of the sales amounts of four Apparel departments from $2018$ to $2019.$
- The total sales amounts of the four HomeDecor departments increased by $\text{Rs} \; 70$ Crores from $2018$ to $2019.$
- The sales amounts in the HomeDecor departments Delhi and Bengaluru each increased by $\text{Rs} \; 20$ crores from $2018$ to $2019.$
- The sales amounts in the Apparel departments of Delhi and Bengaluru each increased by the same amount in $2019$ from $2018.$ The sales amounts in the Apparel departments of Mumbai and Kolkata also each increased by the same amount in $2019$ from $2018.$
- The sales amounts in the Apparel departments of Delhi, Kolkata and Bengaluru in $2019$ followed an Arithmetic Progression.
In HomeDecor departments of which cities were the sales amounts the highest in $2018$ and $2019,$ respectively$?$
- Delhi and Delhi
- Mumbai and Mumbai
- Bengaluru and Delhi
- Mumbai and Delhi