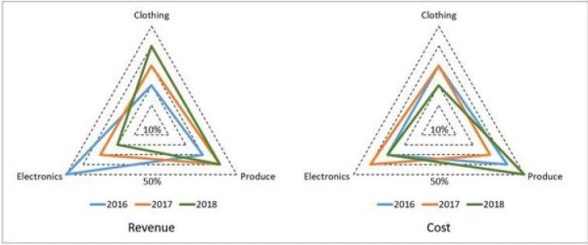
A large store has only three departments, Clothing, Produce, and Electronics. The following figure shows the percentages of revenue and cost from the three departments for the years $2016, 2017$ and $2018$. The dotted lines depict percentage levels. So for example, in $2016$, $50\%$ of store's revenue came from its Electronics department while $40\%$ of its costs were incurred in the Produce
department.
In this setup, Profit is computed as (Revenue – Cost) and Percentage Profit as
Profit/Cost $\times100\%$
It is known that
1. The percentage profit for the store in $2016$ was $100\%$.
2. The store’s revenue doubled from $2016$ to $2017$, and its cost doubled from
$2016$ to $2018$.
3. There was no profit from the Electronics department in $2017$.
4. In $2018$, the revenue from the Clothing department was the same as the
cost incurred in the Produce department.
What was the ratio of revenue generated from the Produce department in $2017$ to that in $2018$?
- $16: 9$
- $9: 16$
- $8: 5$
- $4: 3$