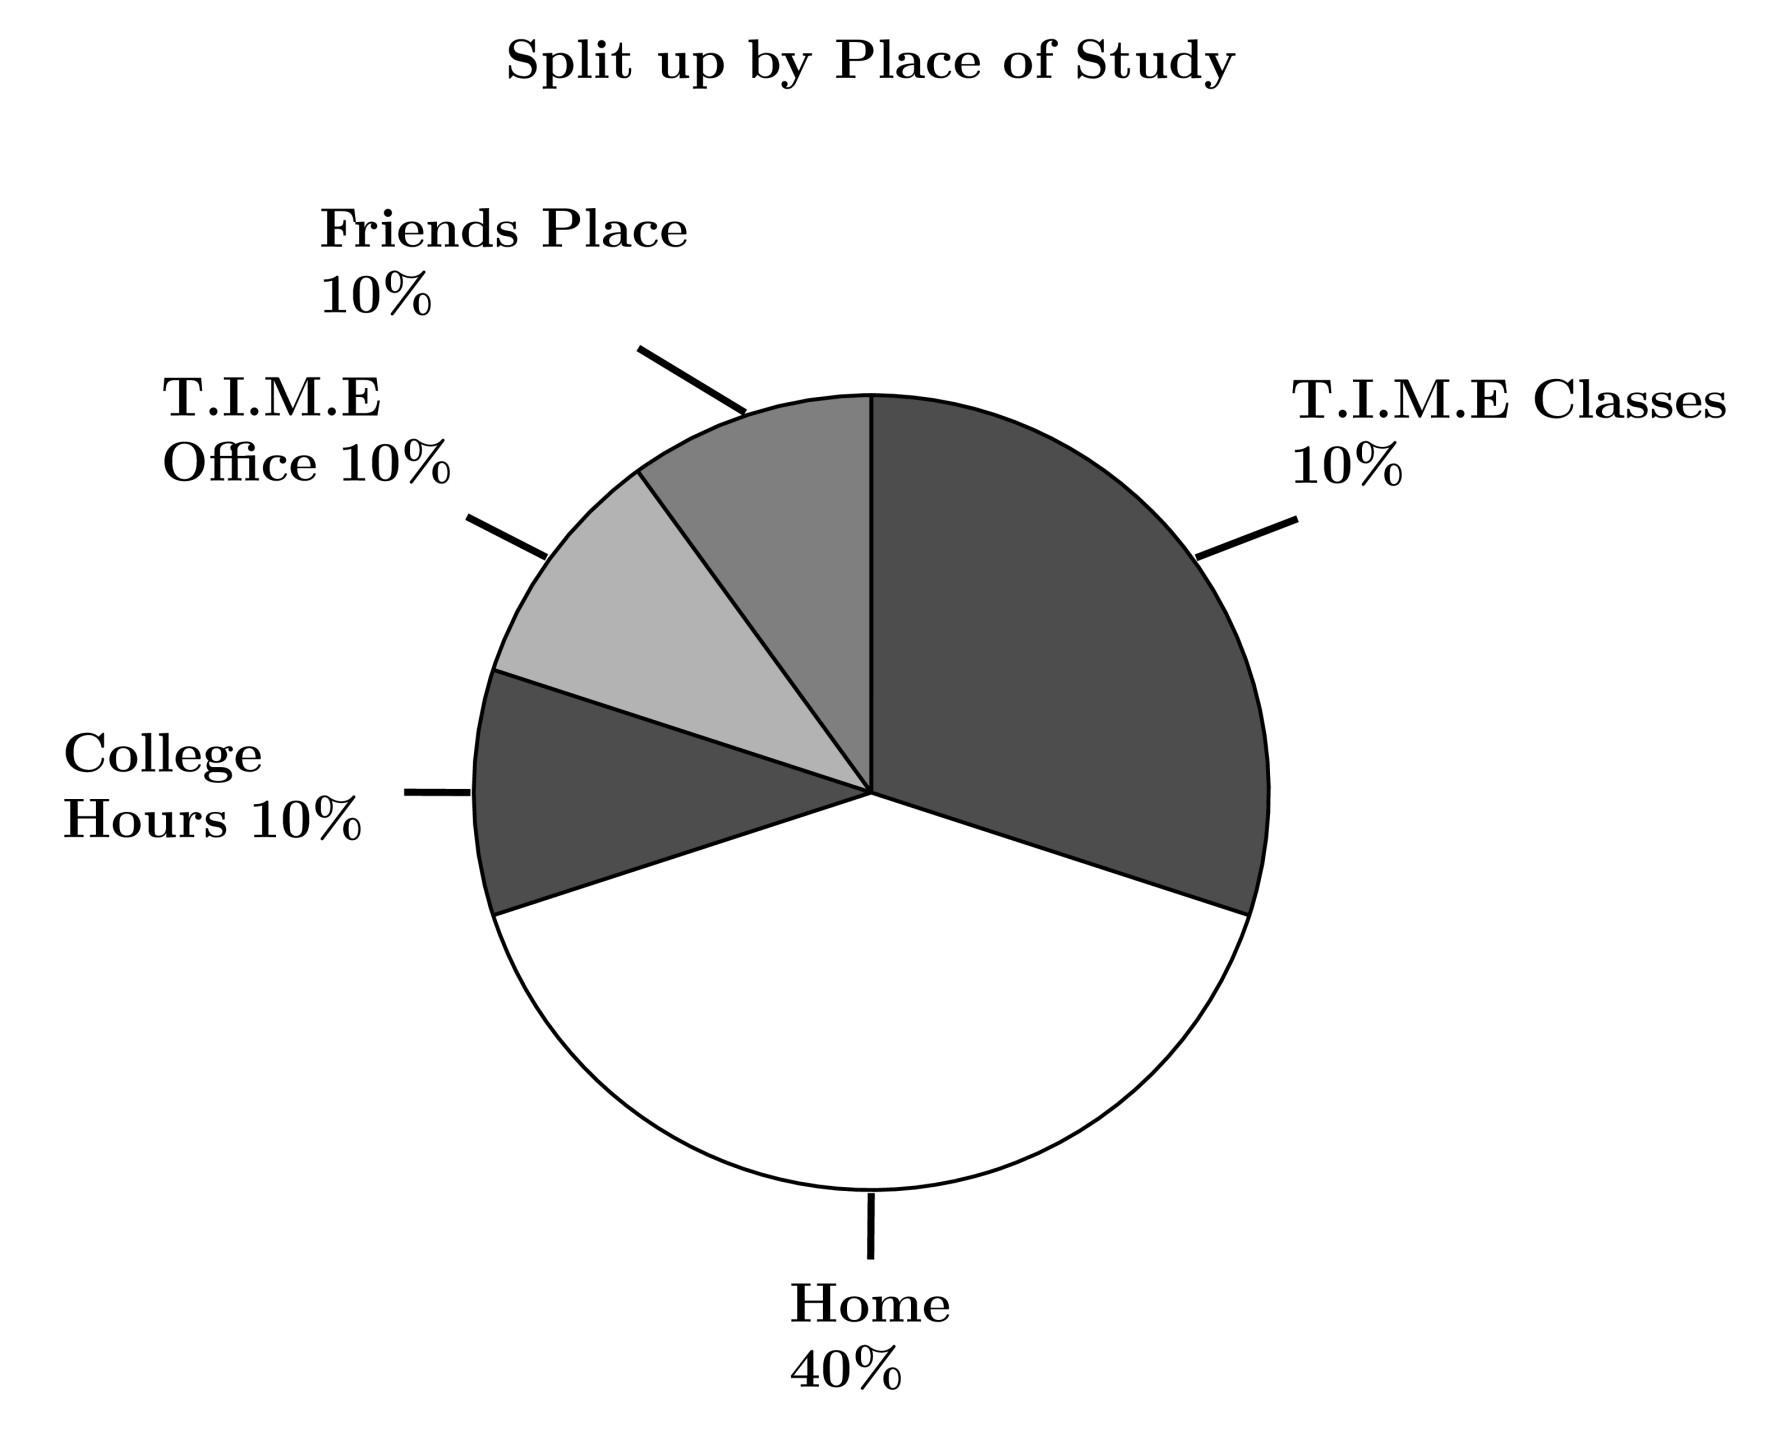
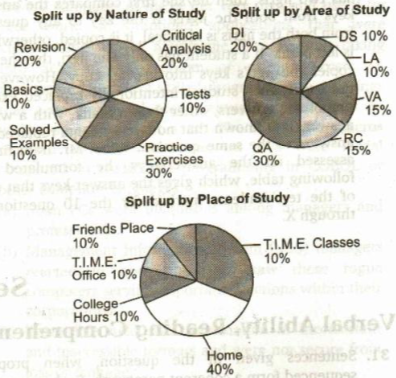
Each of the following pie charts gives the percentage split up of the total time spent by a certain student towards preparation of CAT $2005$
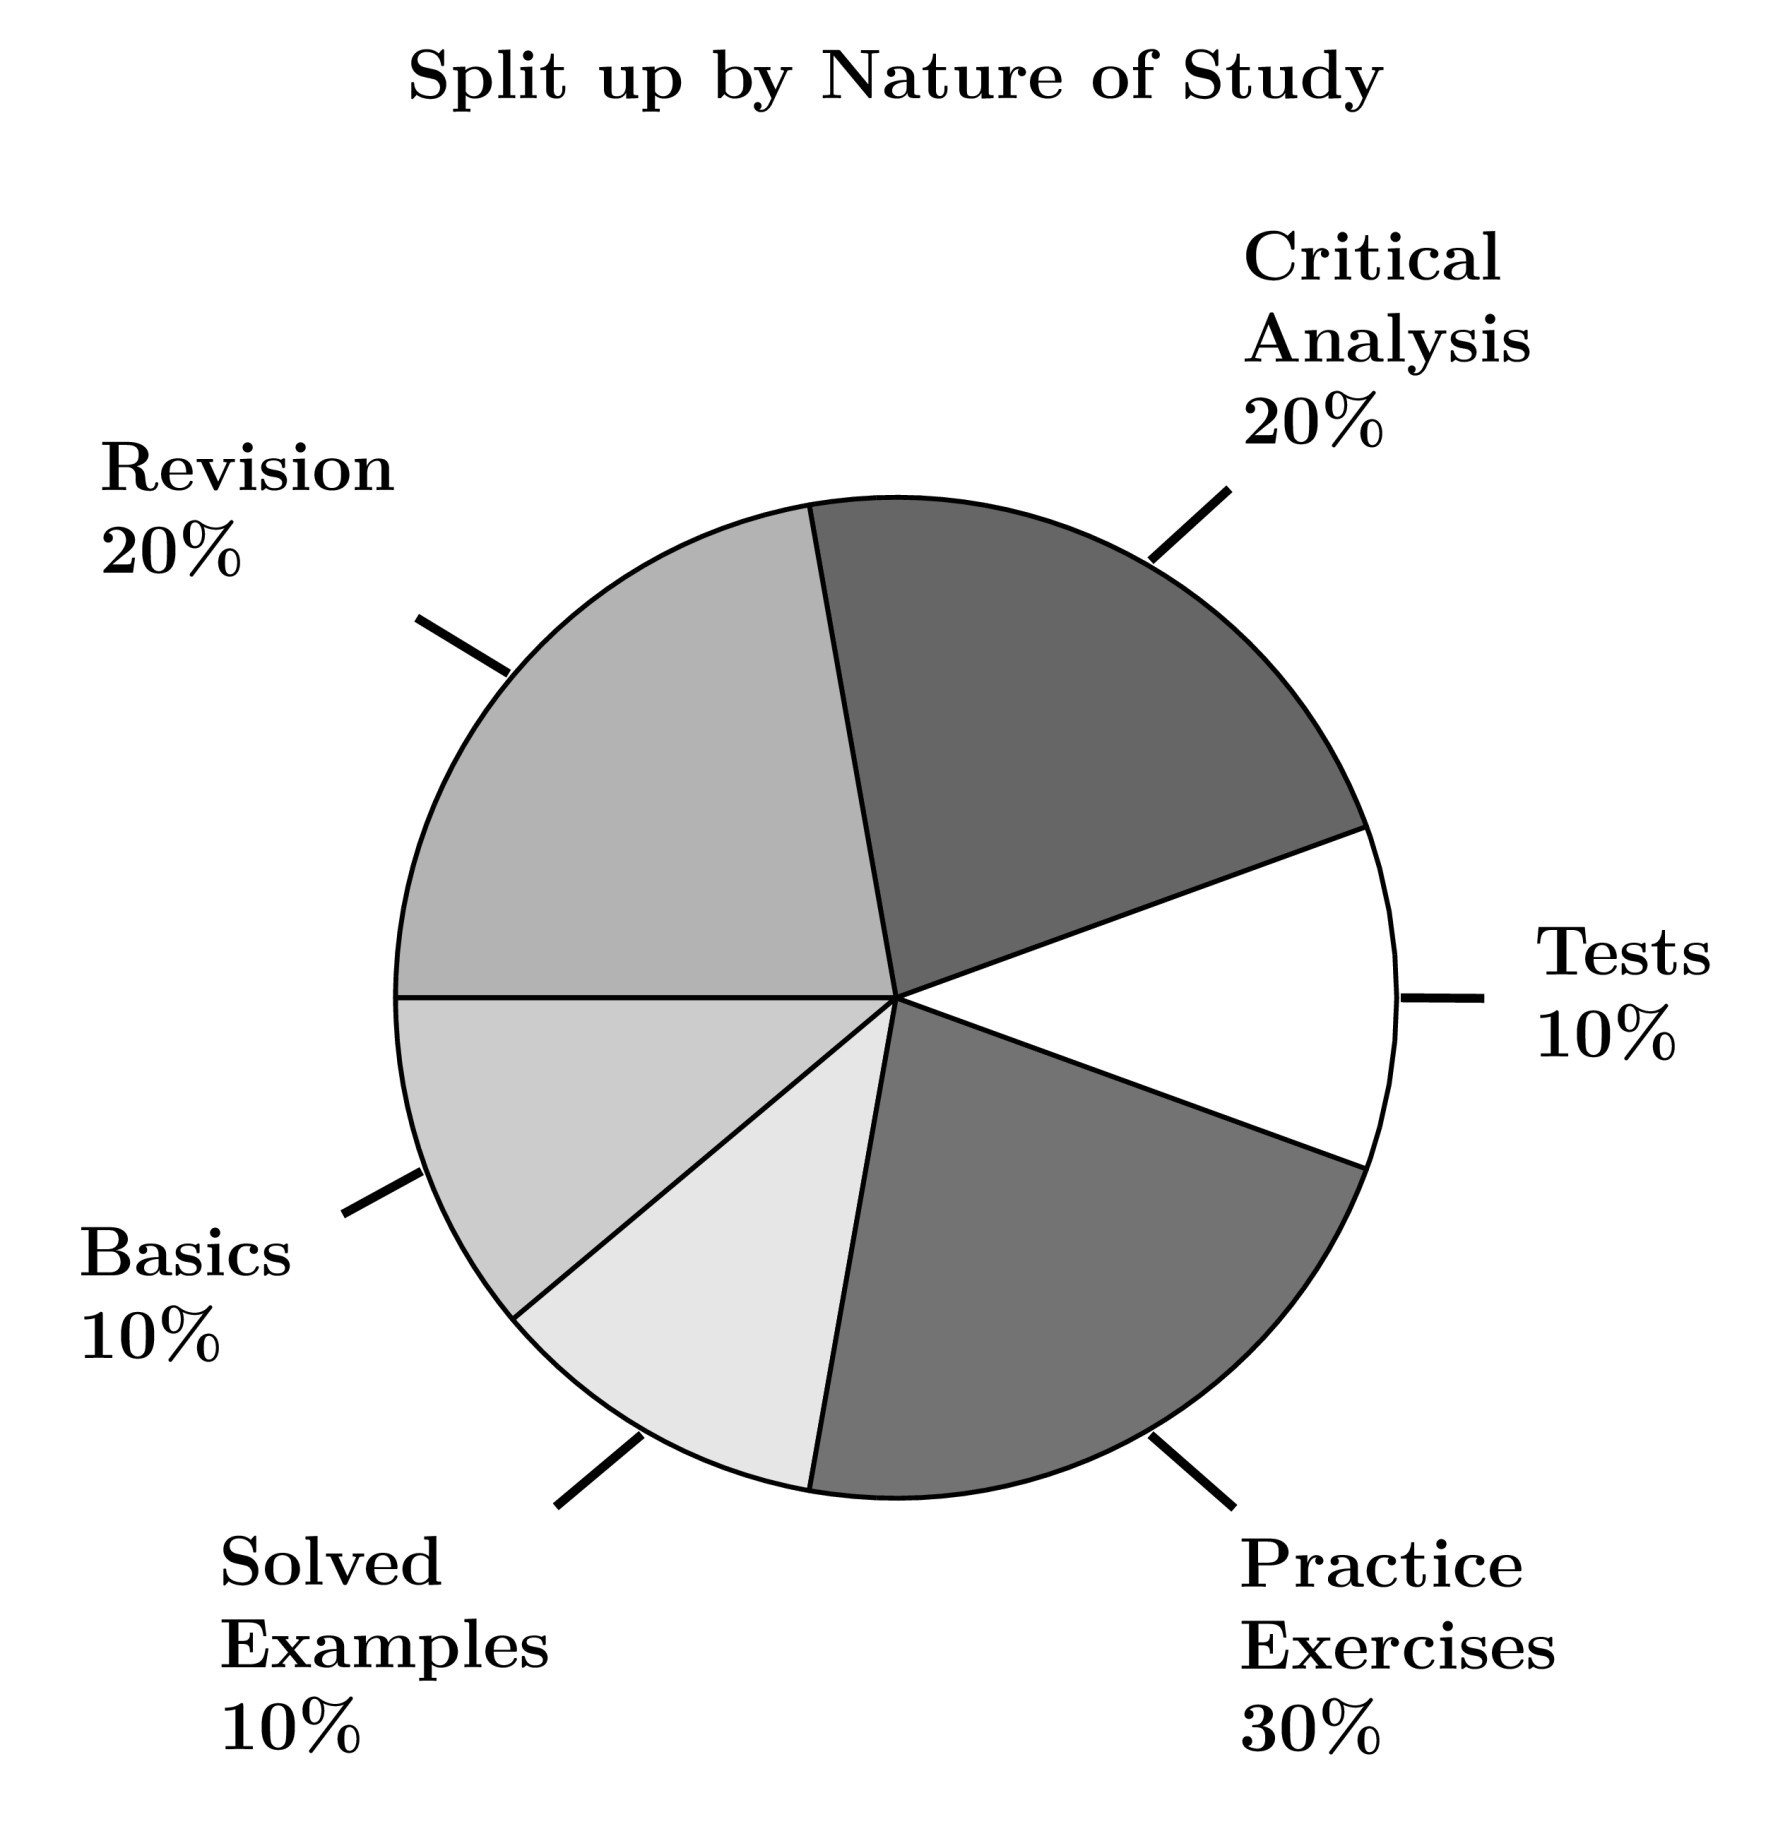
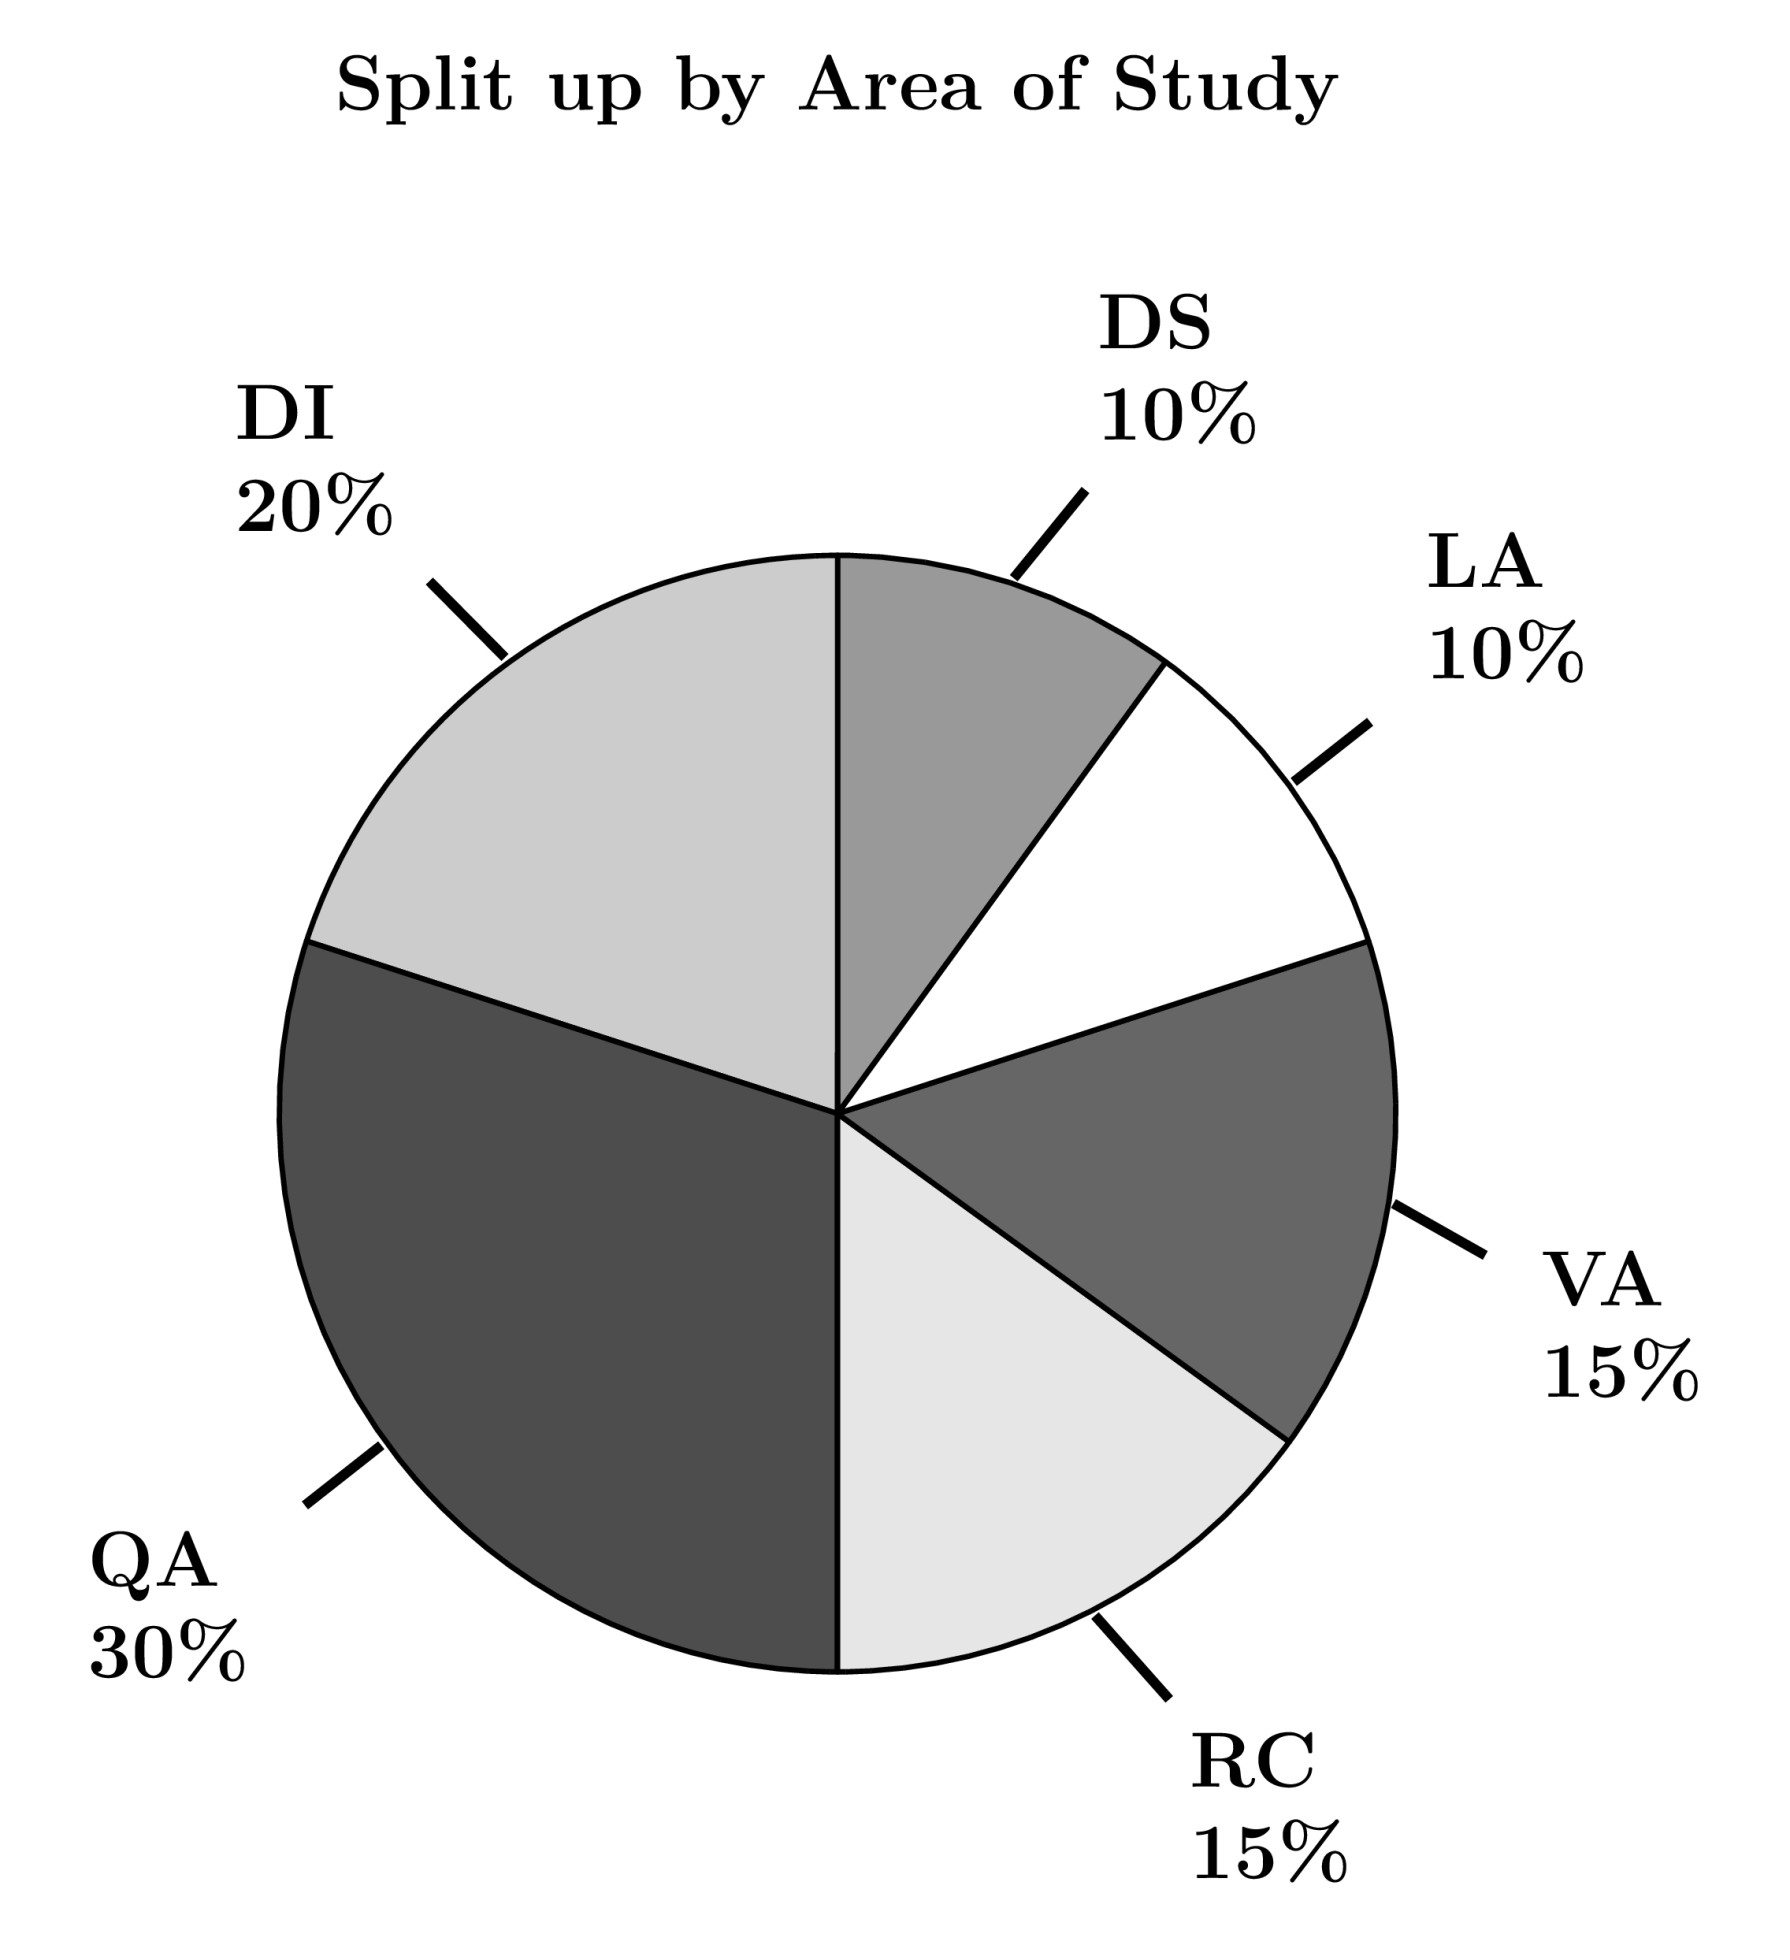
If atleast $5\%$ of the time spent on each area of study was spent on solved examples of that area, then the time spent on solved examples in any area of study, as percentage of the total time spent on that area of study, is at most.
- $21\frac{1}{6}\%$
- $30\%$
- $38\frac{1}{3}\%$
- $55\%$