Each of the following pie charts gives the percentage split up of the total time spent by a certain student towards preparation of CAT $2005$
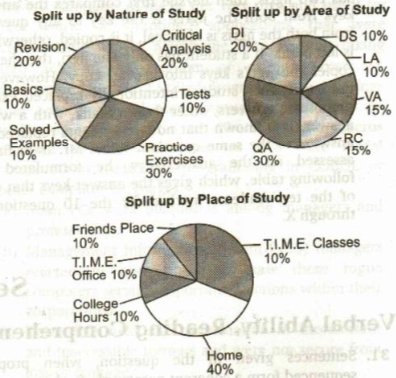
At the most what percentage of total time was spent on test taken in VA and LA?
- $10\%$
- $20\%$
- $66\frac{2}{3}\%$
- $100\%$