in Quantitative Aptitude recategorized by
472 views
–1 vote
–1 vote

Use the following data:

A manufacturer can choose from any of the three types of tests available for checking the quality of his product. The graph gives the relative costs for each of these tests for a given percentage of defective pieces.
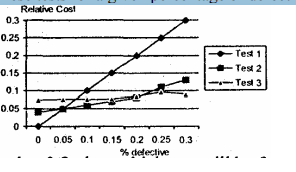
If $p <0.2$, then the best alternative will be:.

  1. Test-2
  2. Test-3
  3. Test-1
  4. Not Test-3
in Quantitative Aptitude recategorized by
8.0k points
472 views

Please log in or register to answer this question.

Related questions

Quick search syntax
tags tag:apple
author user:martin
title title:apple
content content:apple
exclude -tag:apple
force match +apple
views views:100
score score:10
answers answers:2
is accepted isaccepted:true
is closed isclosed:true