use the following data:
A manufacturer can choose from any of the three types of tests available for checking the quality of his product. The graph gives the relative costs for each of these tests for a given percentage of defective pieces.
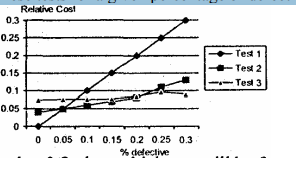
When will Test-$3$ be feasible?
- $P > 0.2$
- $0.1 < p < 0.2$
- $0.05 < p < 0.1$
- $P < 0.05$