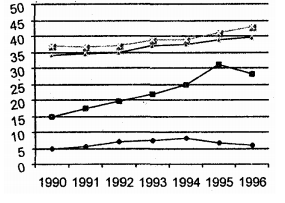
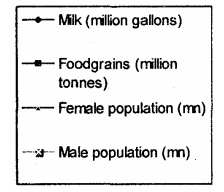
0 votes 0 votes These questions are based on the following graph. When was the per capita production of food grains the most? 1992 1993 1994 1995 Quantitative Aptitude cat1997 quantitative-aptitude data-interpretation graphs + – makhdoom ghaya asked Jun 7, 2017 • recategorized Aug 10, 2017 by go_editor makhdoom ghaya 8.0k points 467 views answer comment Share See all 0 reply Please log in or register to add a comment.