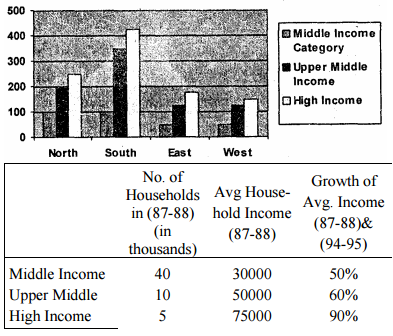
The following bar chart gives percentage growth in household incomes of the middle, upper middle and high income categories in the four regions for the period between $87-88$ to $94-95$.
What was the total household income in Northern Region for upper middle class?
- $50$ lakhs
- $500$ million
- $3000$ million
- Cannot be determined