There are six companies, $1$ through $6.$ All of these companies use six operations, A through F. The following graph shows the distribution of efforts put in by each company in these six operations.
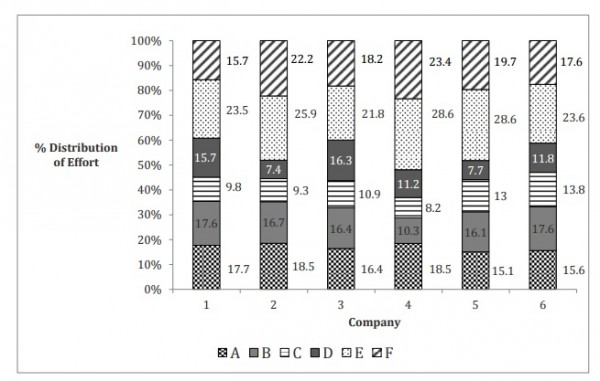
A new technology is introduced in company $4$ such that the total efforts for operations B through F get evenly distributed among these. What is the change in the percentage of effort in operation E?
- Reduction of $12.3$
- Increase of $12.3$
- Reduction of $5.6$
- Increase of $5.6$