Answer below questions based on the following information:
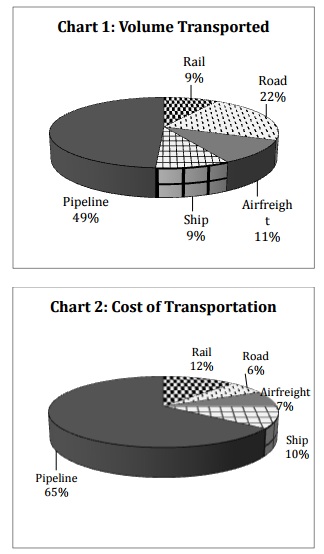
The questions are based on the pie charts given below. Chart $1$ shows the distribution of twelve million tons of crude oil transported through different modes over a specific period of time. Chart $2$ shows the distribution of the cost of transporting this crude oil. The total cost was Rs. $30$ million.
If the costs per ton of transport by ship, air and road are represented by $\text{P, Q and R}$ respectively, which of the following is true?
- $\text{R > Q > P}$
- $\text{P > R > Q}$
- $\text{P > Q > R}$
- $\text{R > P > Q}$