Answer the following question based on the information given below.
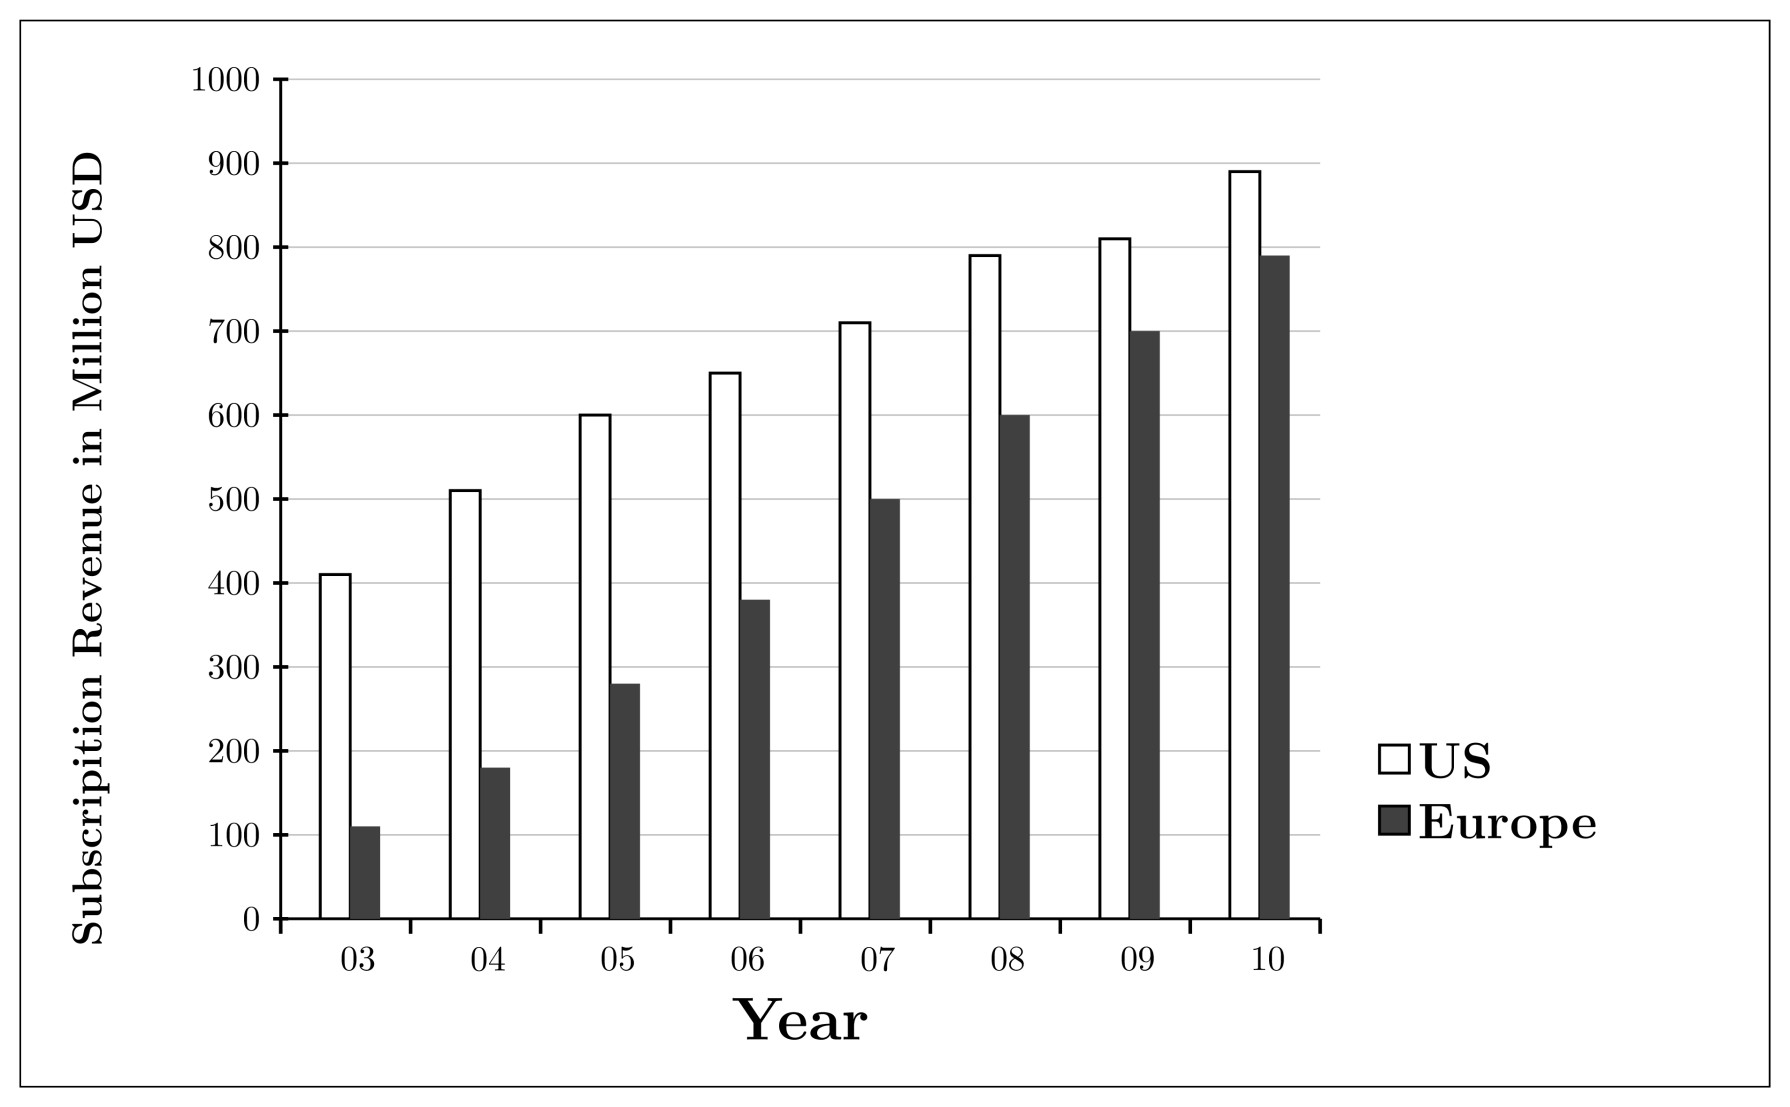
The bar chart shows the revenue received, in million US Dollars (USD), from subscribers to a particular Internet service. The data covers the period $2003-2007$ for the Unites States (US) and Europe. The bar chart also shows the estimated revenues from subscription to this service for the period $2008 – 2010.$
In $2003$, sixty percent of subscribers in Europe were men. Given that women subscribers increase at the rate of $10$ percent per annum and men subscribers at the rate of $5$ percent per annum, what is the approximate percentage of growth of subscribers between $2003$ and $2010$ in Europe. The subscription prices are volatile and may change each years change.
- $62$
- $15$
- $78$
- $84$
- $50$