recategorized by
614 views
0 votes
0 votes

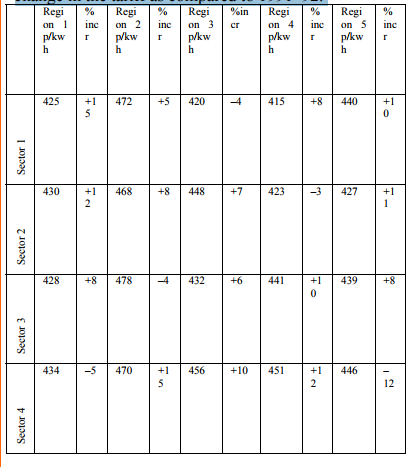
The following table gives the tariff (in paise per kilo-watt-hour) levied by the UPSEB in $1994–95$, in the four sectors and the regions within them. The table also gives the percentage change in the tariff as compared to $1991–92$.

If the amount of power consumed by the various regions in Sector $1$ is the same, then, as compared to $1991-92$, the net tariff in $1994- 95$:

  1. Increases by $6.5$%
  2. Decreases by $3.5$%
  3. Increases by $10.2$%
  4. Decreases by $7.3$%
recategorized by

Please log in or register to answer this question.

Related questions

0 votes
0 votes
0 answers
1
0 votes
0 votes
0 answers
2
0 votes
0 votes
0 answers
3
makhdoom ghaya asked Jun 15, 2017
478 views
The questions are based on the following information.What is the simple annual rate of increase in the number of Agricultural loans from $1970$ to $1983$?$132$%$81$%$75$%...
0 votes
0 votes
0 answers
4
makhdoom ghaya asked Jun 15, 2017
449 views
The questions are based on the following information.In which year was the number of loans per rural bank the least?$1974$$1971$$1970$ $1975$
0 votes
0 votes
0 answers
5
makhdoom ghaya asked Jun 15, 2017
543 views
The questions are based on the following information.What is the value of Agricultural loans in 1983 at 1970 prices?326531753085None of these