Answer the following question based on the information given below.
The bar chart shows the revenue received, in million US Dollars (USD), from subscribers to a particular Internet service. The data covers the period $2003-2007$ for the Unites States (US) and Europe. The bar chart also shows the estimated revenues from subscription to this service for the period $2008 – 2010.$
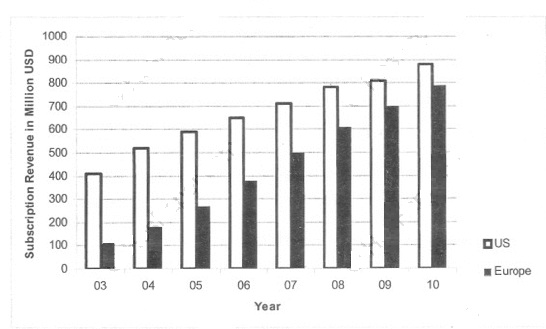
While the subscription in Europe has been growing steadily towards that of the US, the growth rate in Europe seems to be declining. which of the following is closest to the percent change in growth rate of 2007 (over 2006) relative to the growth rate of 2005 (over 2004)?
- $17$
- $20$
- $35$
- $60$
- $100$